美國首季非農業生產力以年率計升 0.8%,勞工成本增 3.3%
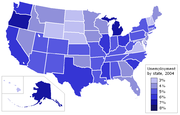
美國 4月份失業率微增 0.4個百分點至 8.9%,為 1983年 9月以來最高,期內非農業職位減少 53.9萬個,是半年來最低,亦少於預期的 60萬個,主要因美國人口普查局為應付 10年一次的人口普查,上月共招聘 14萬名臨時員工。至於 3月份批發庫存則跌 1.6%,遜預期。
由上面條link話比我地知,除左上面所講嘅臨時職位,原來放棄搵工嘅人比3月係多左,所以失業率先附合預期,唔知若果唔計上述兩項會點呢?
再睇length of unemployment 呢項,平均都有成21個月係無嘢做,中位數都有成一年有多。
根據wiki,原來美國失業係分幾層
United States Bureau of Labor Statistics
The Bureau of Labor Statistics measures employment and unemployment (of those over 15 years of age) using two different labor force surveys[28]conducted by the United States Census Bureau (within the United States Department of Commerce) and/or the Bureau of Labor Statistics (within theUnited States Department of Labor) that gather employment statistics monthly. The Current Population Survey (CPS), or "Household Survey", conducts a survey based on a sample of 60,000 households. This Survey measures the unemployment rate based on the ILO definition.[29] The data is also used to calculate 5 alternate measures of unemployment as a percentage of the labor force based on different definitions noted as U1 through U6:[30]
- U1: Percentage of labor force unemployed 15 weeks or longer.
- U2: Percentage of labor force who lost jobs or completed temporary work.
- U3: Official unemployment rate per ILO definition.
- U4: U3 + "discouraged workers", or those who have stopped looking for work because current economic conditions make them believe that no work is available for them.
- U5: U4 + other "marginally attached workers", or those who "would like" and are able to work, but have not looked for work recently.
- U6: U5 + Part time workers who want to work full time, but can not due to economic reasons.
再睇埋呢個pdf
唔知大家對於美國嘅失業情況有無佢公報咁好呢?
至於非農生產力,上升嘅原因係hours worked dropping 9% and output only dropping 8.2% (poof, productivity gains!).明未?
都係個句啦,魔鬼在細節中!

 Sunday, May 17, 2009
 Jay
Jay


0 comments:
Post a Comment